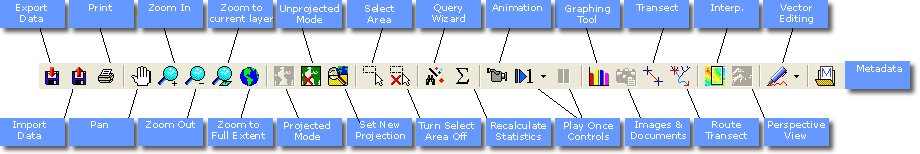
Tool Bar
The Tool bar contains the following icons:
Click on an icon to select an option from the Tool Bar.
Details of each Tool Bar icons are given in the following sections of the STEMgis Help.
The Export button allows the user to save the spatial and/or attribute data for the Active Layer to a file(s) where its type is determined by the contents of the layer as follows:
The Import button allows the user to import map data from an external file format. STEMgis will read the following formats:
Note: STEMgis MAP format map files and SIPS format image files can be imported directly from the File menu.
The Print button allows the user to print the map currently displayed in the Map Window. In STEMgis FreeView a standard map layout is printed while in the full version of the Viewer the user may design their own map layout format using the Print Designer.
The Pan button is used to reposition the centre of the map view.
The Zoom In button enables a rubber band box with which the user can define an area of the Map Window to be enlarged.
The Zoom Out button can be clicked to zoom out of the current view of the map by a factor of two.
The Zoom to Current Layer button can be clicked to zoom to the extent of the currently selected map layer.
The Zoom to Full Extent button can be used to bring the Map Viewer back to its default view of the entire projected or unprojected map area.
The Projection Mode button changes the projection state to projected and uses the currently defined map projection.
The Unprojected Mode button can be clicked to display an unprojected map in the Map Window with co-ordinates in terms of latitude and longitude.
The Set Projection button sets the current projection for the map window.
The Select Area button enables a rubber band box with which the user can define a new select area.
The Select Area Off button toggles the dashed rectangle showing the location of the select area on and off .
The Query Wizard button allows the user to select features and their attributes for display in the Map Window.
The Recalculate Statistics button provides the ability to change the temporal and depth slices on a layer that has already been retrieved from the database.
The Animator button is used to animate the result of queries which return time-series data.
The Play Once Control buttons are used to animate once through a time cycle. After clicking on the play button the animation starts from the first time slice and plays through to the end. The pause button can be used to stop the animation at any time.
The Graph button is used to display a graph for any feature displayed in the active layer of the Map Window and for which attribute information has been retrieved from the database into memory.
The Images, Documents and Movies button is used to display non-geolocated images, documents or movies, for example, benthic photographs or borehole logs. Click the icon and then left-click on a site. Images will appear in an image window with which the user can zoom and pan around the image. Documents appear in the application associated with the filename of the document, e.g. .doc files might appear in Microsoft Word. Movie files appear in a movie player window.
The Transect button allows the user to define a linear transect. Once defined a profile of attribute versus distance along transect is drawn in the graph tool.
The Route Transect button allows the user to define a non-linear transect that follows linked features. The user clicks on a features and a transect is plotted using the graph tool.
The Interpolation Tool button is enabled when a point layer is made active. This tool creates an interpolated grid by fitting a surface through data points in either a horizontal or vertical plane.
The Perspective View button is enabled when Digital Elevation Model (DEM) data are displayed. It pops up a dialog that allows the user to manipulate how the DEM is viewed in 3D.
The Draw Vectors icon enables the drawing of vector-based trapezia in a new layer or by adding to an existing layer.
The View Metadata is enabled when the current layer has one or more metadata entries associated with it. It allows the user to view these metadata entries.
| Browser Based Help. Published by chm2web software. |