Query Wizard
The Query Wizard provides an easy one to five step selection and recovery of features and their attributes for display as maps, graphs, or animations. The actual steps involved in a particular Query will depend on the Feature Types selected and whether or not they have attributes, temporal and/or depth components associated with them.
The possible steps in the Query Wizard are:
To invoke the Query Wizard do one of the following:
Objects are recorded in the database as Features. The main classification of features is referred to as their feature type. Some examples of feature types in the database might be:
River monitoring station
Marine monitoring station
Borehole
Individual features have attributes associated with them that record their location, name and the measurements/attributes at/of the site or object.
Two examples of the Query Wizard are detailed below:
Using the Query Wizard to retrieve Features with associated Attributes and Time and/or Depth Components
The following example shows the sequence of steps necessary for the Query Wizard to retrieve and display Features and the Attributes associated with these Features. The Attributes may or may not have time and /or depth components.
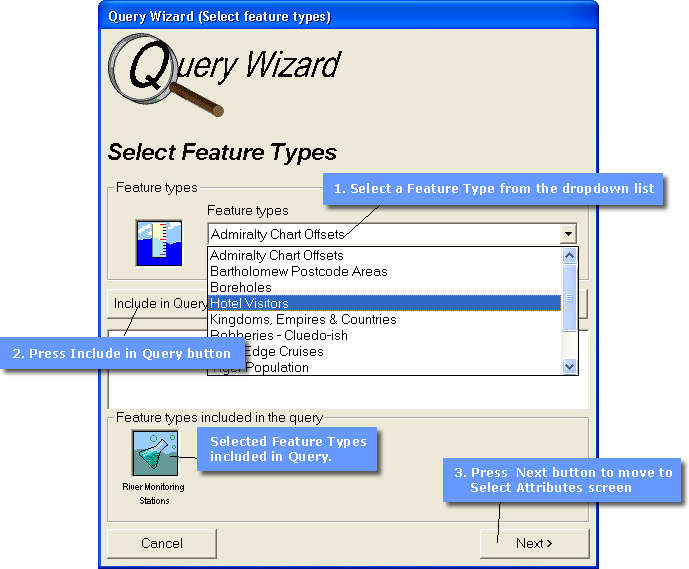
Select Feature Types
The first step, which is common to all use of the Query Wizard, is the selection of up to 5 Feature Types. This is done through the Select Features screen shown below and following the sequence shown. In the example screen River Monitoring Stations has been selected as a Feature Type to include in the query. Up to 4 other Feature Types can be selected by repeating steps 1 and 2. You would only select more than one Feature Type if you wished to compare attribute values which spanned a number of feature types. An example of this might be an investigation of water pollutants where the feature types may have been defined as River Monitoring Stations and Marine Stations.
Select Attributes
In this step up to 5 Attributes may be chosen. The Attributes available for selection will be restricted to those associated with the Feature Types selected in the previous screen. The available Attributes may be arranged in several different Dictionaries, e.g. Chemical Dictionary (CHEM), Physical Dictionary (PHYS). The number and arrangement of the Dictionaries is determined by the user at the time data is loaded into the database using the STEMgis Manager. To select Attributes from any of the Dictionaries follow the sequence shown. In the example below Alkalinity and Manganese have been selected as Attributes to include in the query. Up to 3 other Attributes can be selected by repeating steps 1,2 and 3.
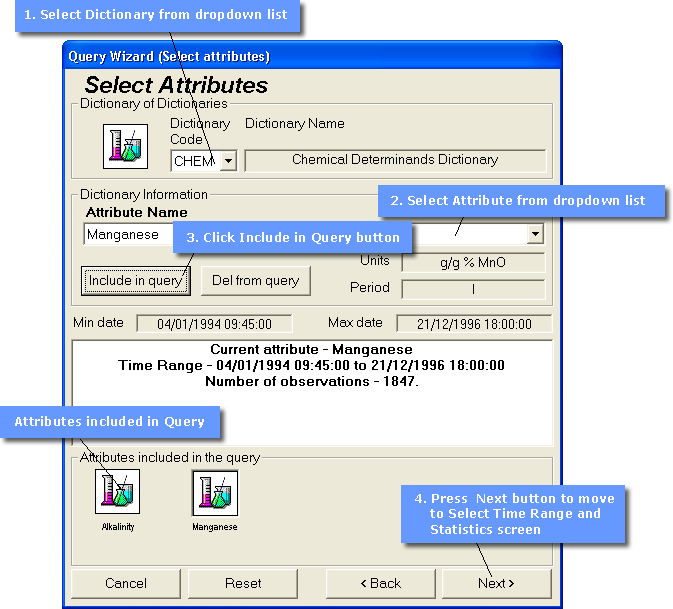
When an Attribute is included in the query (step 3) information is recovered from the database regarding the start and end dates and time, the units of measurement and number of observations for each Attribute and displayed within the Select Attribute dialog box.
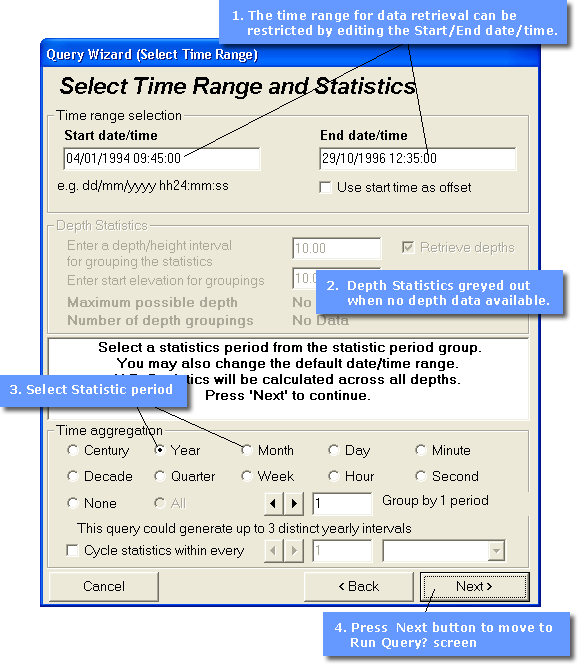
Select Time Range and Statistics
In this step the user selects the time range to be covered by the query, the depth statistics and the statistics period. If any of these are not available, e.g. there may not be a depth component, that section of the dialog box will be greyed out.
On entry to the Select Time Range and Statistics dialog box the date and time displayed in the Start date/time and End date/time fields is the maximum time range of data stored in the database for the selected Features and Attributes within the Area of Interest. These start and end dates and times may be edited manually to further restrict the time range for which data will be retrieved, e.g. in the example below changing the Start date/time to 22/12/1995 18:00:00 would reduce the query from just under 3 years to a 1 year time range.
The Statistic Period section allows the user to select the time interval over which the raw data will be aggregated for statistical purposes. This may be in the form of either Linear Time Aggregates or Cyclical Time Aggregates.
For Linear Time Aggregation the user may choose a statistical period from seconds to centuries. This period is used to aggregate the data in a linear manner, e.g. the raw data may have been measured twice a week for three years but the data can be aggregated to provide a series of mean monthly values throughout the full three years, by selecting Month as the statistic period. By entering a value in the Group by field aggregate periods other than those available through the radio buttons can be obtained, e.g. selecting Year and entering a value of 3 in the Group by field would give a 3 year statistical period. If a statistic period is chosen which might generate more than 750 time intervals for the requested data then an warning message will be displayed. This situation can be rectified by either selecting a larger statistic period or by editing the Start date/time and/or End date/time to reduce the time range.
For Cyclical Time Aggregation the user may additionally choose a statistical periods by which to aggregate the data in a cyclical manner, e.g. calculate a mean for each month in a hypothetical year based on raw data for a number of years. In the data example described above, 12 timeslices would be returned for each month of a years and each month would represent mean values for each January, each February and son on.
Your data may also have attributes varying with depth. By checking or unchecking the Retrieve depths box the user may choose whether or not to retrieve depth statistics if a depth component is present in the data. Different values may be entered for the depth/height interval and the start elevation to provide different depth slices.
Run Query?
The Run Query? dialog box provides a summary of the query set up in the previous screens and by means of the Back button provides a mechanism to revisit those screens to modify the query. In order to proceed with the query the user must click on either the Retrieve sites only button or click on the Retrieve sites and data button. The Retrieve sites only button is useful if you are not familiar with the data sets held in the database and wish to have a quick look at the geographical location of the available data.
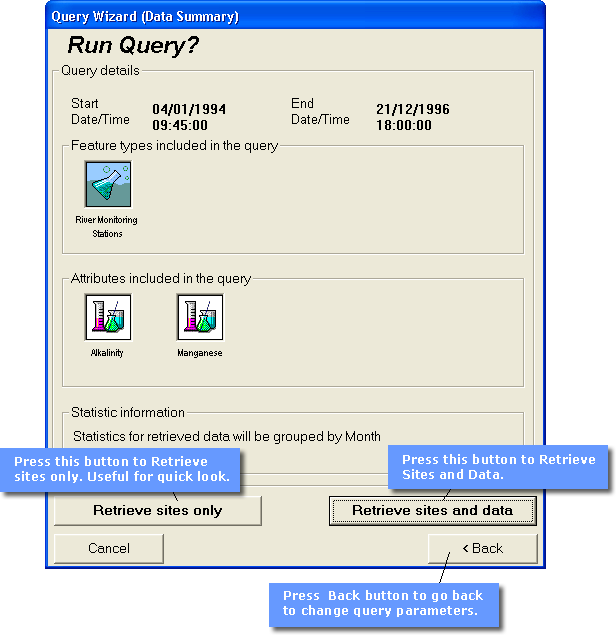
At any time after either of the retrieval buttons have been clicked, the query may be interrupted by clicking on the Cancel button or pressing the Esc key. This will terminate the query and no data will be retrieved from the cancelled query.
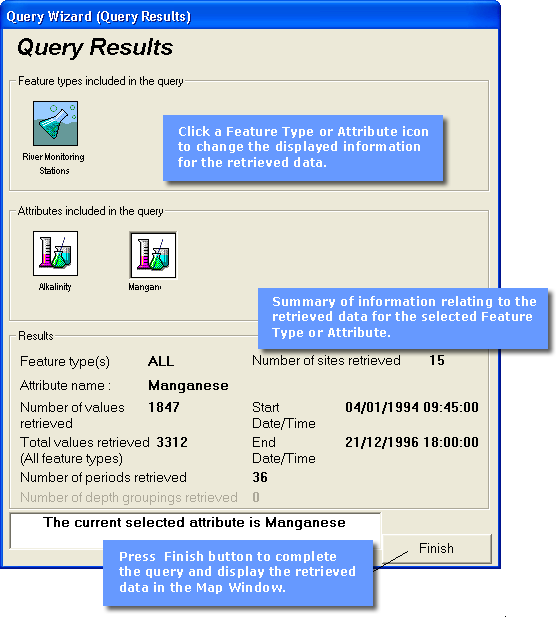
Query Results
The Query Results dialog box provides a summary of the data retrieved for each Feature and Attribute included in the query. Clicking on the icon for a selected Feature or Attribute will display the summary information for that Feature or Attribute. Clicking the Finish button will complete the query and display the retrieved data in the Map Window.
Retrieved data displayed in the Map Window
The Map Window will show the retrieved data for the selected Feature(s) and Attribute(s), the geographical location of the Area of Interest and the Zoom In area in the Locator map, the Legend for the displayed data, and the Time bar divided up into however intervals are required for the displayed data and the selected Statistic Period. Further details of these screen elements are given in the Screen Components section.
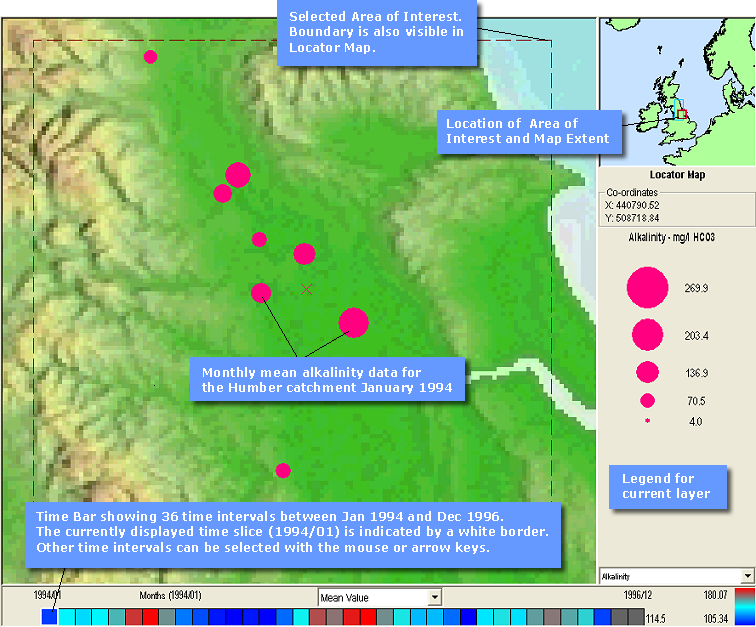
The Time Bar shows 36 time intervals between January 1994 and December 1996 for which alkalinity measurements are contained within the database. The currently displayed tome interval (July 1994) is indicated by a white border. Another time interval can be selected either by clicking on it with the mouse, or by using the left or right arrow keys. Alternatively the whole time sequence can be animated using the Animator Tool.
Using the Query Wizard to retrieve Features with NO Attributes
Some Features have no Attributes and no time or depth components associated with them. In this example only the Select Feature Types step is used.
Note: This method can also be used to just retrieve sites from a feature type rather than including any of their attributes. This is useful for quickly viewing where data might exist. The user may then right click on any retrieved features to list the attributes that are measured there.
Select Feature Types
In this step, which is common to all use of the Query Wizard, the user can select up to 5 Feature Types.
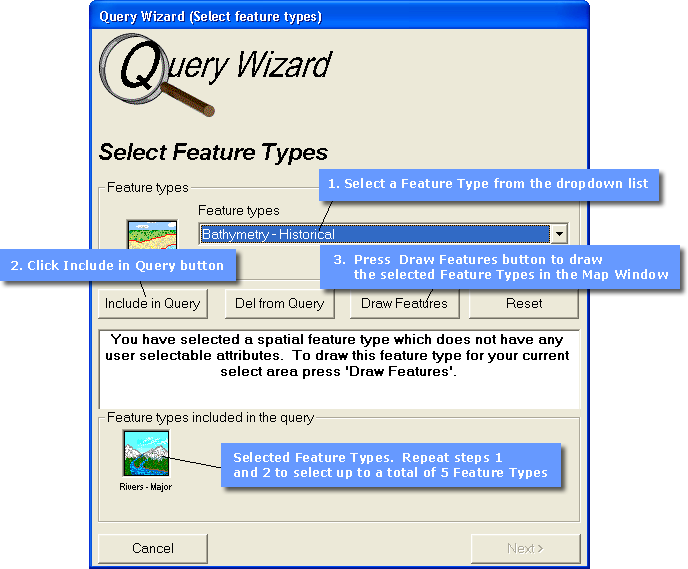
Clicking on the Draw Features button will complete the query and draw the selected Features in the Map Window.
| Browser Based Help. Published by chm2web software. |