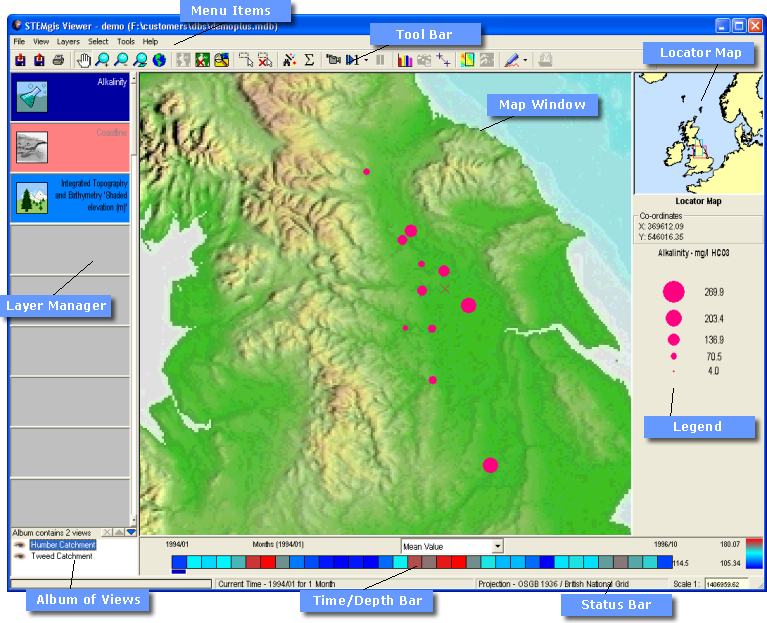
Screen Components
The main screen consists of the following eight elements:
The Time/Depth Bar is created and displayed when a query with time or depth data has completed.

When data, such as temperature, that vary over time and/or with depth are retrieved, they are displayed in the Map Window as proportional symbols placed at the site of measurement. The first data values shown on the map will be those for the first period in time or interval in depth.
The time/depth bar allows the user to browse through time and depth, viewing the changing values in the process.
The time and depth bars are similar in appearance and work the same way. Each division represents an interval in time or depth as requested in the query that retrieved the data. Hovering over the bar will cause the time or depth represented by that segment to be displayed. Clicking the bar will cause the Viewer to display the data values for that time or depth.
For layers with attributes, a drop down menu appears above the centre of the time/depth bar that allows the user to make the symbols represent a number of statistic relating to the data. These include:
Again, for layers with attributes, the colour of the boxes in the bar represent the statistics for all sites for the chosen time/depth interval. The key at the far right of the bar indicates the range of possible values for the active layer. The currently selected time/depth interval is highlighted in a number of ways; the selected element has a blue marker box below it, the selected interval is shown to the left of the drop-down list and in the status bar and the chosen statistic is displayed numerically to the right of the time/depth bar.
For layers without attributes, the boxes are coloured with a seven colour cycle, merely to provide a difference between successive time or depth slices.
Note: When measurement frequency and location frequency are selected from the drop-down list, the colouring of the bar changes but the symbols on the map represent the mean values for the chosen interval.
![]()
If the data vary in depth and time, there will be an icon at the left hand end of the bar which will toggle the bar between depth and time. If you change from a time view to a depth view, the data displayed in the Map Viewer will be for the last time increment that was chosen. Correspondingly, if you move back to the time view the data will be for the last depth selected. The time and depth bars may be thought of as two 1-D slices through a 2-D time versus depth space.
Note: You can manually animate through both time and depth sequences by selecting an interval on the time bar (left-click) and then using the arrow keys on the keyboard to scroll through each interval.
The Status Bar is used to keep the user informed as to current activity of the Map Viewer for example, during a query the status bar might display the following messages in turn: Identifying Points, Finding Unique Times or Stats for query.
The status message Ready indicates that the Map Viewer has finished processing and is ready to perform any actions requested by the user.
![]()
The Status Bar also provides information on the current time and depth, the current projection and map scale.
It is possible to manually set the scale of the Map Window by typing a scaling factor into the scale box at the right hand side of the status bar. The scale calculation depends on the size of your screen. This can be specified via the View->Options menu item.
| Browser Based Help. Published by chm2web software. |