Graph Tool
Introduction
Once a Query which returns data has been executed it is possible to access
the information retrieved as a graph. To use this facility click the Graph
icon ![]() in the Toolbar and then left click on the site whose
data you wish to graph.
in the Toolbar and then left click on the site whose
data you wish to graph.
By default, the data are graphed against one of three parameters depending on the data returned from the query:
Once the graphing tool is loaded the axes may be changed and other data may be loaded.
The menu bar in the Graph Tool window contains the following options:

The File menu contains the following options:
Select a printer and change the printer properties in the standard Windows manner.

The Zoom menu items provide a comprehensive means of altering the scale at which the graph is viewed. This is useful when details of a complicated graph or a graph with attributes covering different temporal limits are being viewed. An example of the use of the Zoom tools is shown below. The second image shows the effect of zooming in on the area highlighted by the yellow square in the first image. Selecting Zoom to full extent of data will restore the graph to its original scale.
Full scale:

Zoomed in:

The Properties menu contains the following options:
By default, the axes match the range of data to be graphed. They
may also be set manually by selecting Axes from the Properties Menu.
An absolute threshold value or a threshold range may be set for the selected attribute. This may be useful for visualizing how often a limit (e.g. statutory) has been exceeded. This option sets the value but does not display it on the graph. To display the threshold value use the User defined option on the Threshold menu.
The Attributes on Y menu contains the following option:
![]()
Initially, all attributes within a query are displayed together on a graph. If you wish to turn some of the attributes off you can do so by unchecking the menu item in the 'Attributes On Y' Menu.
The Plot Versus menu contains the following options:
For data retrieved with both time and depth it is possible to change the value against which the data are plotted. To create a depth profile, select Depth from the Plot Versus menu and then plot the attributes on the X-axis by unchecking the Attributes on Y menu item from the Plot Versus menu.
It is also possible to plot one attribute against another by selecting an attribute from the Plot Versus menu. It is important to note that when an attribute is selected from the Plot Versus menu then it is automatically deselected from the Attributes On Y menu, to avoid plotting that data as a straight line on the graph. Therefore, when you return to plot the data against time or depth you will need to turn the attribute back on in the Attributes On Y menu.

When plotting one attribute against another, only coincident data are shown. The data must coincident in terms of time and depth.
The Statistics menu contains the following options:
By default, the full dataset is displayed in a graph. To display the statistics that were calculated during the query, select Statistics from the Menu Bar and chose the statistic required.
Statistics:

Note: When you select a statistics plot you should note that some restrictions from the map display still apply. For example, if you have retrieved depth and time with your data and then plot a time series, the time series shown will relate only to the currently displayed depth interval (shown in the status bar). Conversely, a depth profile of statistics will only show data from the current time.
The Sites menu contains the following options:

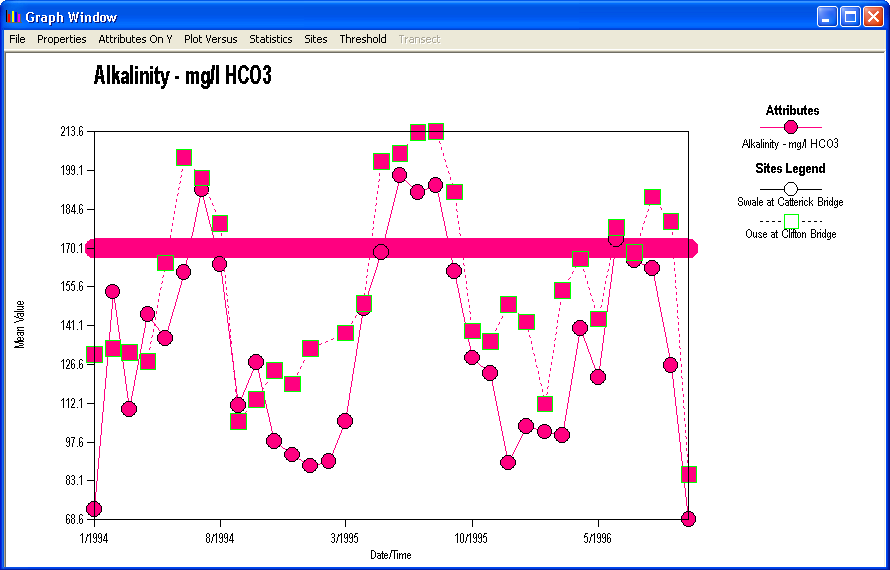
To compare data between sites, it is possible to add up to 5 sites by selecting 'Add Sites to Graph' from the Sites Menu. Each site is represented by a different shaped symbol and/or different dashed lines. The colour of each symbol and line remains true to the attribute colour on the map display (Example).
The Threshold menu contains the following options:
The User specified option acts as a toggle to add or remove from the graph a horizontal bar representing the threshold vale set with the Threshold option of the Properties menu.
The Transect menu contains the following options:
To show transects for all dates or depths, or to show the transect for the current time and depth use the above options from the Transect menu. To add transects for selected dates use Select Specific Transect and the following list will appear.
Select the transects you wish to display and click OK.
When you are graphing vector data with depth slices it is possible to graph the attribute values along a vertical transect. The following graph has been produces after drawing a transect on such data and then selecting Plot Versus->Height/Depth and Transect->Show all heights.
![]()
Other Notes
Some attributes can be defined as character/string rather than numerical data. When data of this type are plotted on a graph a section of the graph area is reserved for the character data. For time series data this will be the top part of the graph and for depth plots will be the right hand section. The colour of the symbol relates to the colours specified in the map legend.
Notes: The generic nature of the graphing tool means that it is possible to create some unusual effects, therefore be sure that you have chosen appropriate parameters.
| Browser Based Help. Published by chm2web software. |

