 |
|||||||||
|
|
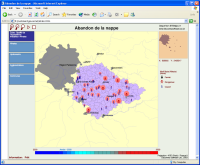
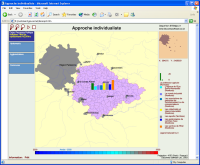
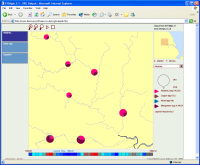
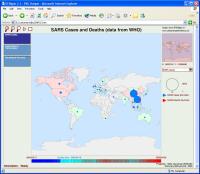
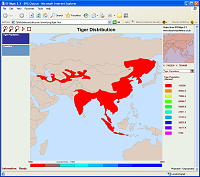
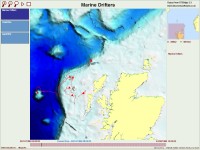
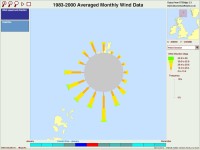
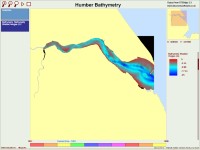
Example SVG Maps If you do not already have it you will need to download the SVG Viewer plugin from Adobe.
Click on each thumbnail to see the SVG file. N.B. You may have to allow active content if Internet Explorer automatically blocks the content. Help on using the STEMgis SVG interface can be found here.
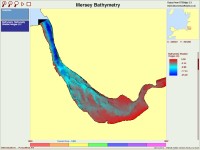
The following examples will form part of an upcoming online report about the 'State of the Seas' by the Inter-Agency Committee on Marine Science and Technology in the UK. Click on the thumbnails to view the SVG maps.
|