Step 5 - Viewing the Data
When you have created a new STEMgis database it can be opened in the STEMgis Viewer by using the File>Open STEMgis Database option from the Menu Bar or it can be opened by using a shortcut for the database on your desktop. The shortcut method can be useful if you are continually opening the STEMgis Viewer with one particular database.
Use the Query Wizard
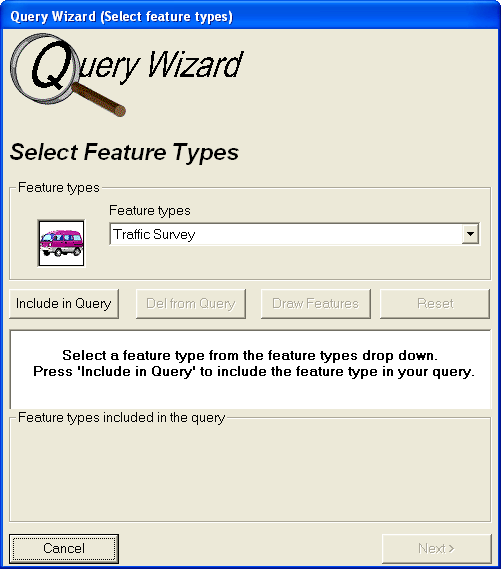
to load a new map layer. Click the query wizard icon on the toolbar ![]() and select the Traffic Survey feature type from the feature type list.
and select the Traffic Survey feature type from the feature type list.
Click on Include in Query and then click on Next. The following attribute selection form appears:
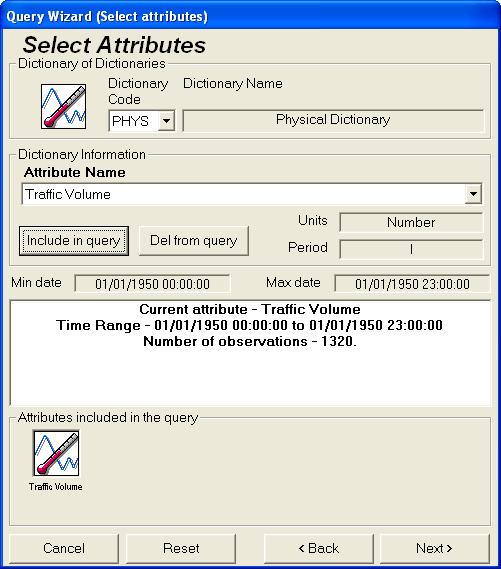
Select Traffic Volume from the Attribute Name list and then click on Include in Query. Note that the form includes details about the units, number of observation recorded in the database and the full date range available. Click on Next to proceed to the next form:
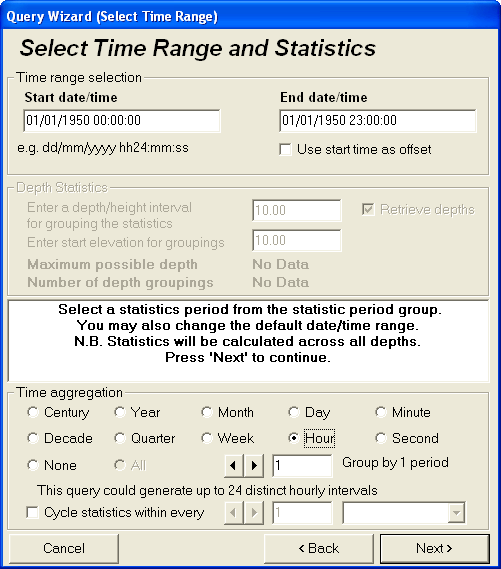
You can use this form to select a time range that you are interested in and to select timeslices that you wish to view the data by. In this case the time range of data is one day and so a good timeslice to use is one hour. Click on the Hour radio button and then click Next.
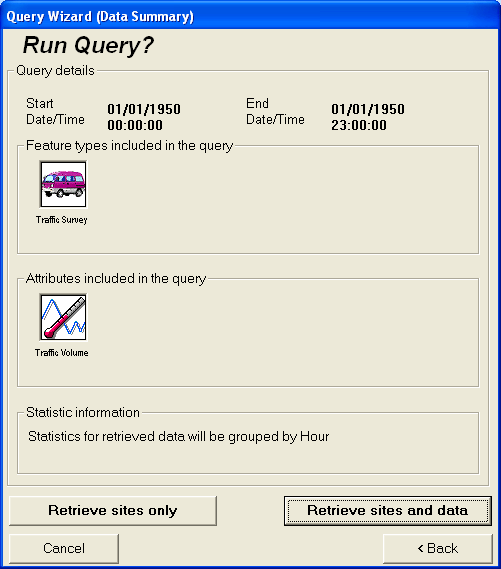
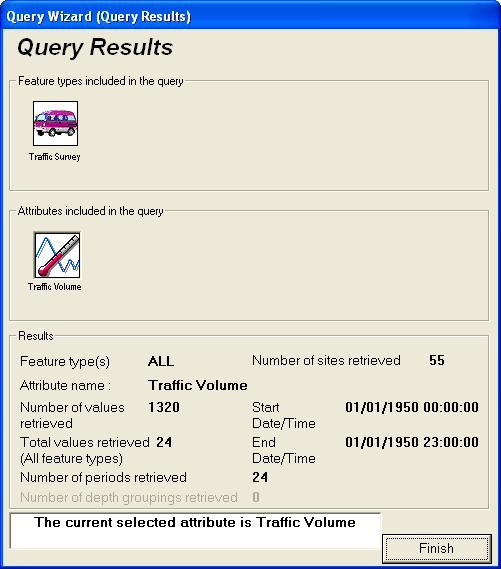
This form provides a quick summary on the query that you have just built. You may go back to change any part of the query. There are two further options here. You can click on Retrieve sites only; this will just retrieve the spatial data. Clicking on the Retrieve sites and data button will retrieve both the spatial and attribute data. Click this button now. The query will now be performed on the tutorial database. This may take a few seconds. When the query is complete the following query summary form will appear.
This form details how many values and sites have been retrieved during the query. Click on the Finish button to end the query wizard and view the map.
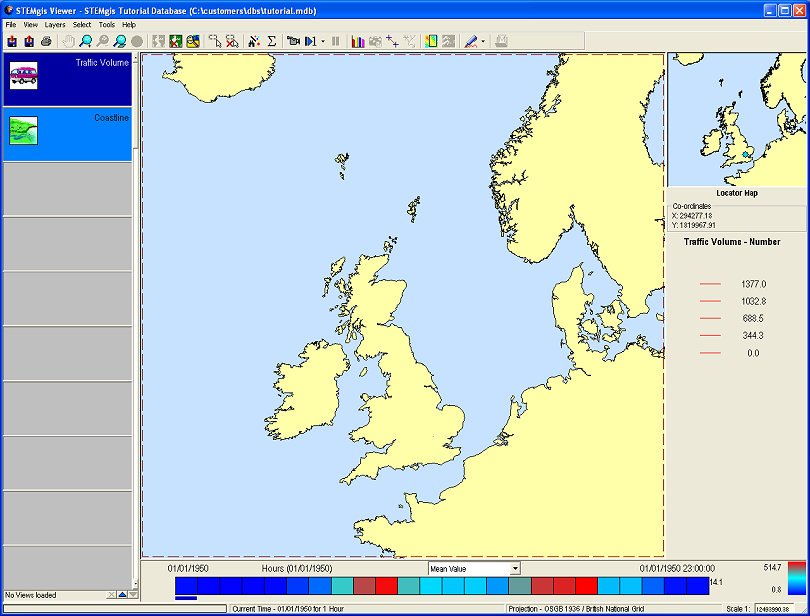
A new layer has appeared in the Layer Manager (to the left of the map area). This is automatically selected as the current layer. You can click on the Zoom to Current Layer icon ![]() on the toolbar. The scale of the map will be automatically set to the extent of the current layer:
on the toolbar. The scale of the map will be automatically set to the extent of the current layer:
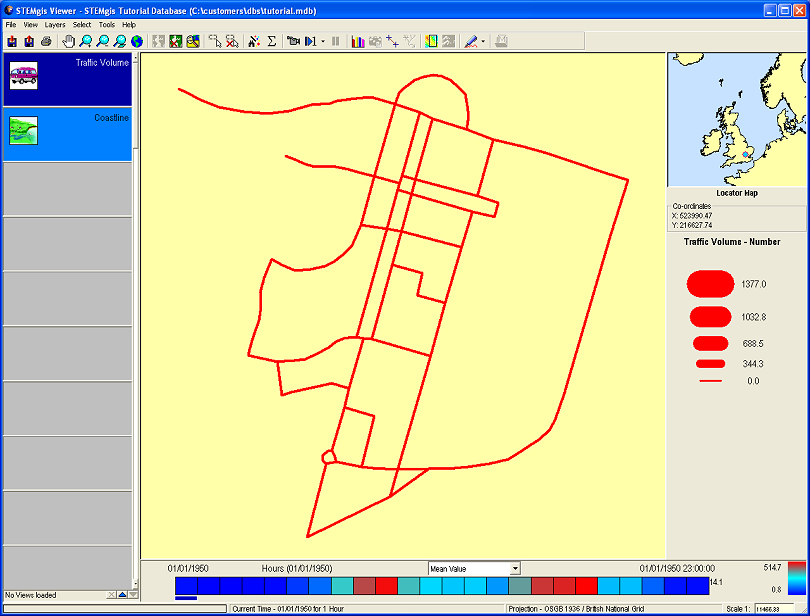
You can click on any of the boxes in the time bar (below the map) to view the associated timeslice or click on the animation tool icon ![]() on the toolbar to animate the layer.
on the toolbar to animate the layer.
| Browser Based Help. Published by chm2web software. |