Animation of spatial data.
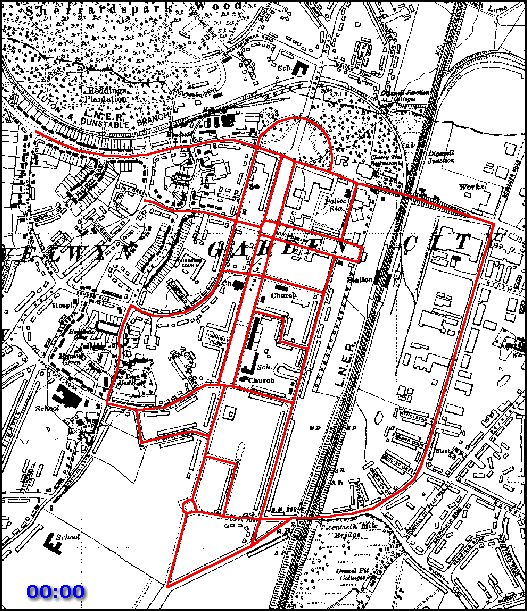
Figure shows simulated traffic volume data for hourly intervals in one day. The widths of the red lines indicate the volume of traffic. Note the morning and evening rush hour periods.
The backdrop image is a 1:10,560 raster map provided by Landmark and is copyright Ordnance Survey.