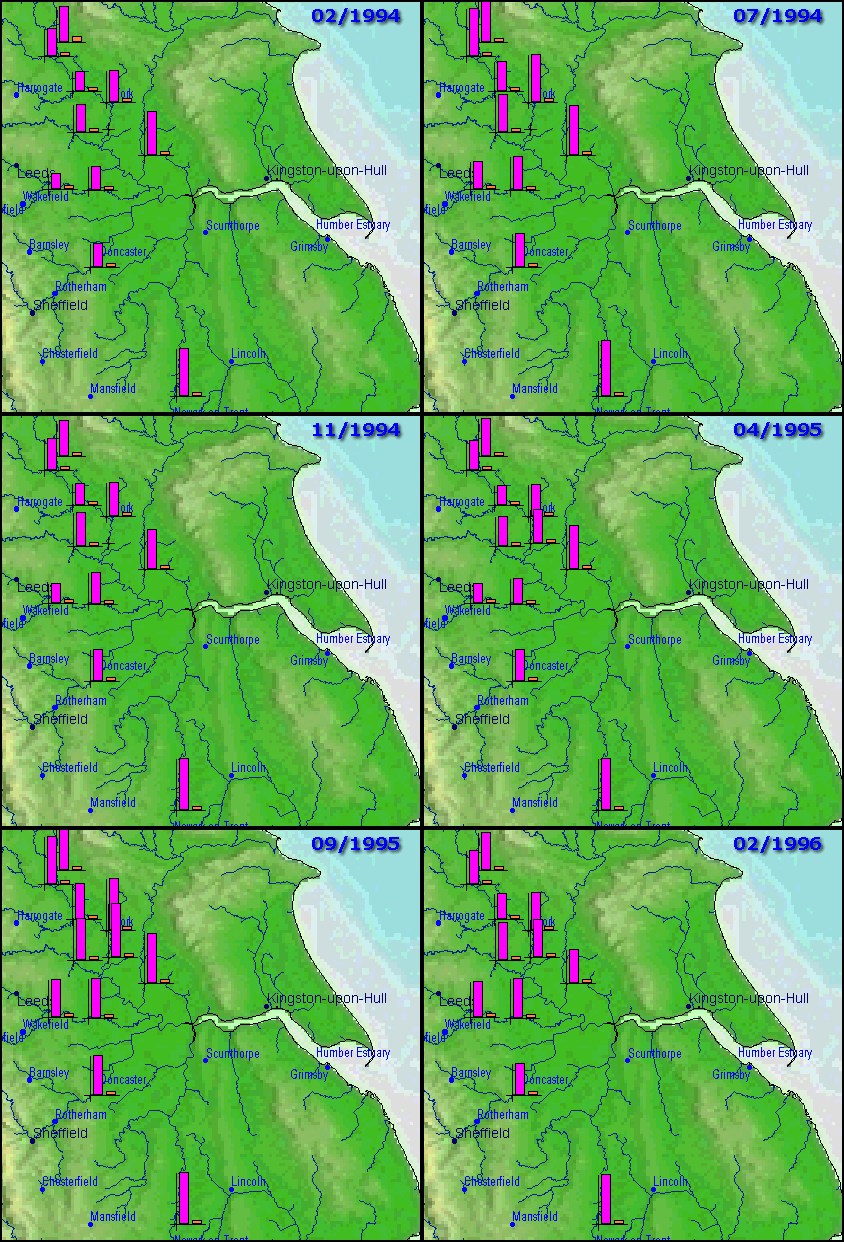
Animation of multiple point attributes.
Alkalinity (pink) and lead dissolved (orange) measured at river monitoring sites and animated as monthly averages over a two year period. A peak in alkalinity tends to occur during the summer months when there is less water volume.
Results of work produced by the LOIS programme, Plymouth Marine Laboratory, UK, as part of the Land-Ocean Interaction Study (LOIS) UK thematic research programme.
Technical detail. The river water quality data were measured every 2 to 4 days but can be displayed within STEMgis as aggregated data over any desired period, e.g. week, month, year etc. The user may also display means, standard deviations, minima and maxima. The full data can be displayed graphically by clicking on a point.
